We have conducted a number of tests on the survey images and the sources extracted therefrom in order to verify our procedures and establish the survey's accuracy in estimating source parameters. In this section, we briefly outline our progress to date.
We have several means at our disposal to verify information derived from our images:
The results of these tests are presented below.
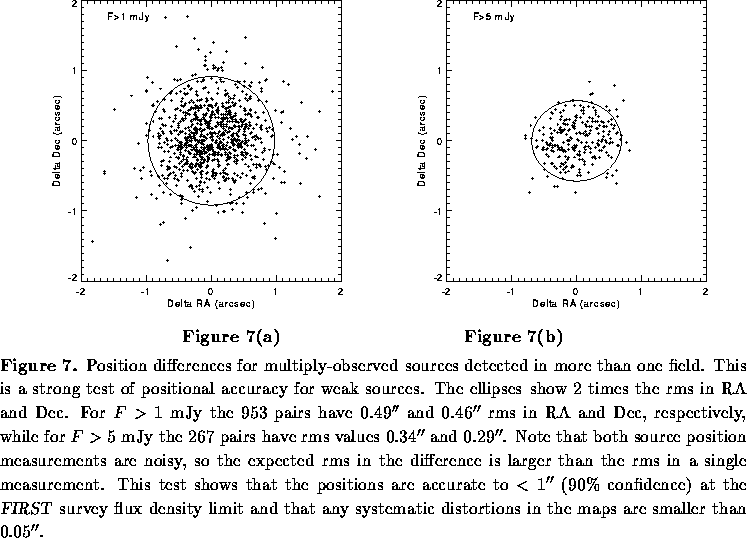
The accuracy of the FIRST positions is excellent. Figure
7 presents the observed scatter for MOS sources detected in the degree region around the North Galactic Pole (NGP). For sources with
flux densities greater than 2 mJy, the reproducibility in individual
positions is
or about one-third of an
arcsecond, leading to a 90%confidence error circle with a radius of
. Even for sources at the 1.0 mJy threshold, the
90%error circle is significantly less than
in
radius. To establish that these positions are accurately tied to an
astrometric reference frame, we have compared the positions of all
MERLIN calibrators found in our
degree strip (46 sources
in total) and find an average offset of
. A
detailed discussion of
astrometric comparisons with optical positions derived from the APM plate
scans will be presented in McMahon et al. (1995); the distribution of
optical/radio offsets for over 4100 objects confirms that FIRST positions
have random errors of
and systematic errors
of
.
The primary aims of the B-configuration survey have always been to reach
a faint flux density threshold, to obtain high resolution images of
extended sources and source complexes, and to achieve optical quality
astrometry. Accurate photometry is a secondary goal which, as with all
interferometric observations, is necessarily compromised by high
angular resolution. Our analysis procedures have been designed to obtain
the best possible photometric accuracy for sources with angular extents
(the synthesized beam size) and to allow for estimation
of systematic flux density errors for all sources. For sources substantially
larger than the synthesized beam, some flux will inevitably be resolved
out, leading to an increase in the survey threshold for extended objects
and an underestimate of source intensities for larger objects. Since one of the
principal aims of the NVSS is accurate photometry on extended and low
surface brightness objects, we do not regard this limitation of FIRST as
a significant problem. Users requiring accurate flux densities
for sources whose structure and optical
identifications have been found by FIRST will be able to consult
NVSS for photometric information on sources brighter than 2.5 mJy;
such information may be included in future versions of FIRST
catalogs. We will also be exploring the utility of combining the FIRST
and NVSS UV datasets to generate a new set of maps with greater sensitivity
to extended objects as soon as some overlap exists between the two surveys (late
1995). Here, we present the photometric properties of the FIRST data
alone.
``CLEAN bias" is a recently recognized error in the flux densities derived from
VLA images. The effect produces a systematic underestimate of flux
densities, the magnitude of which is largely
independent of the true source flux, and thus affects the
weakest sources in a field most severely. The exact cause of this bias is
a matter of some debate (see Condon et al. 1994 for one explanation), but the
net effect is that the CLEANing algorithm steals flux from discrete sources
and spreads it around the image. Using the AIPS task UVMOD to insert artificial
sources in our UV data stream, the least ambiguous test
available to us for determining the accuracy of the flux densities derived
from our images, we find that for fields in which the brightest source
is mJy (
of all fields), the CLEAN bias is typically
mJy for point sources, increasing to 1 mJy and 2-4 mJy for sources
with diameters of 6 arcsec and 12 arcsec, respectively. The CLEAN bias also
increases in maps with higher rms noise levels. For example, for
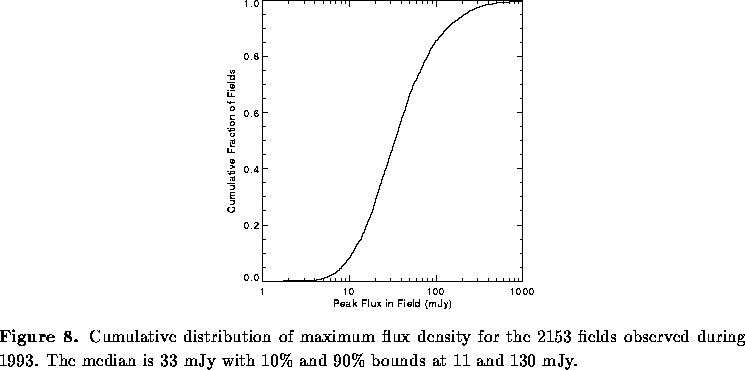
the small number of fields with very bright sources (
mJy; see Fig. 8)
in which uncleaned sidelobes can raise the rms by a factor of 2 to 3,
this bias can reach 0.5 mJy for point sources and even higher values for
extended objects. We have not yet found a way to eliminate this effect, but if
we do, we will reanalyze the the data
in order to correct it. Also, we are working on a calibration
of this effect so that a posteriori corrections will be possible for the
final source catalog.
The results from tests using UVMOD with a range of source sizes and flux
densities on a variety of our UV datasets are given in Table 4 and Fig. 9.
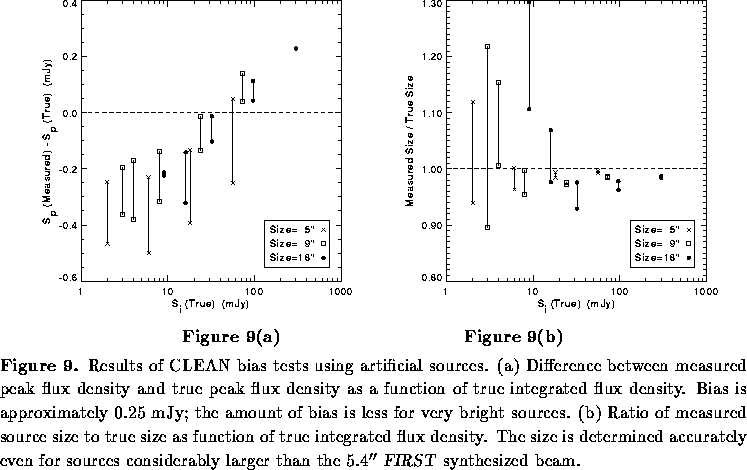
The introduction of artificial sources into the UV data also allows us to make a quantitative estimate of the missing flux density resulting from the absence of short spacings in the B configuration. We find that for sources with diameters of 9, 18, 24, and 30 arcsec we are sensitive to 99%, 97%, 84%, and 77%, respectively, of the true source flux density. For most faint sources, however, the CLEAN bias is a greater problem, and is the determining factor is setting the completeness level of the survey
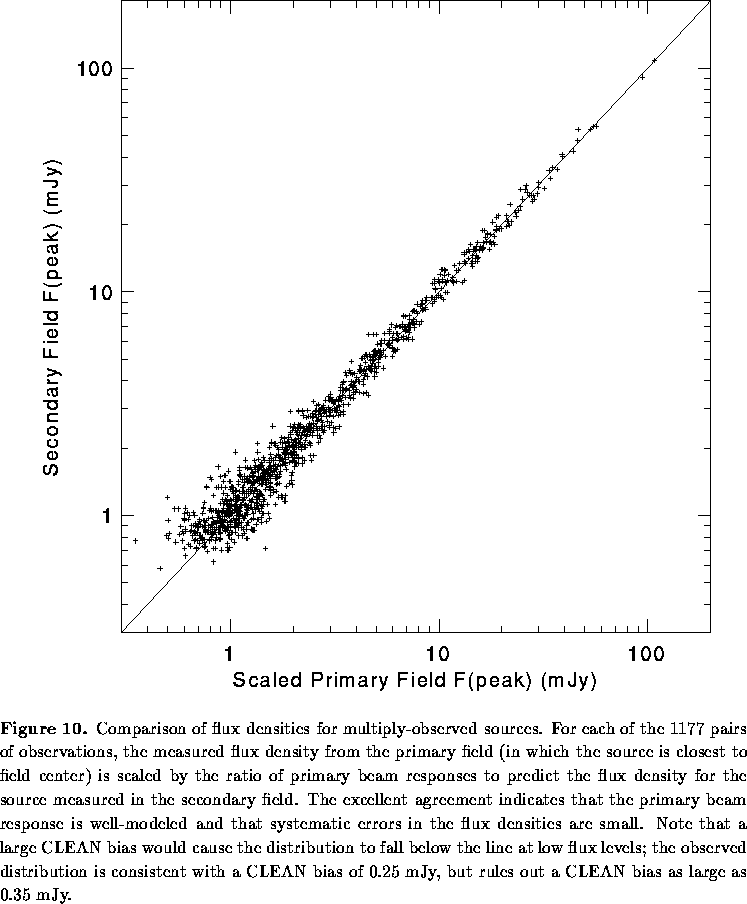
An alternate way to look for CLEAN bias as well as other systematic photometry errors is by comparing flux densities derived for the multiply-observed sources. If all sources in a field suffer from photometric errors prior to the primary beam correction, then after the correction, the error would depend on distance from the field center, and one would expect flux densities for the same object in adjacent fields to differ. Our data show no such effect (see Fig. 10; note that this is also a test of the primary beam correction function, the coefficients of which we have taken from the calibration observations of Condon et al. [1994]). An interesting sidelight of this test is that it also represents the first stage of a search for radio sources which vary on timescales of minutes (from adjacent fields observed the same day) to days (for a source observed on two adjacent strips). It is obvious from Figure 10 that variability by a factor of 2 could be recognized to the survey limit and smaller variability could be detected for brighter sources.
The results from comparing our survey images with existing deep
interferometric surveys at 20 cm are fraught with sparse overlap and
resolution uncertainties. Nonetheless, this is clearly the most meaningful
test for photometric accuracy and survey completeness.
One published deep VLA pointing is contained in the
strip we observed in 1993. A field centered at RA(1950) = 13 00 37,
Dec(1950) = 30 34 was observed for hours at 20cm in the C
configuration, resulting in an image with an rms of
Jy (Mitchell
and Condon 1985). The catalog for this field contains 49 sources with
integrated flux densities greater than 0.75 mJy, our nominal
threshold.
A source-by-source comparison shows that, in the relevant coadded
FIRST survey image, we detect 100%of the 9 sources with an integrated flux density
mJy, 19 out of 20 of
the sources brighter than 2.0 mJy, 71%of the 21 sources between 1 and 2 mJy,
and 63%of the 8 sources between 0.75 and 1.0 mJy (Fig. 11). These values are very
similar to those expected based on the known distribution of angular sizes
for faint sources (see § 3.2 and compare column 4 to column 7 and column 6 to
column 8 in Table 1).
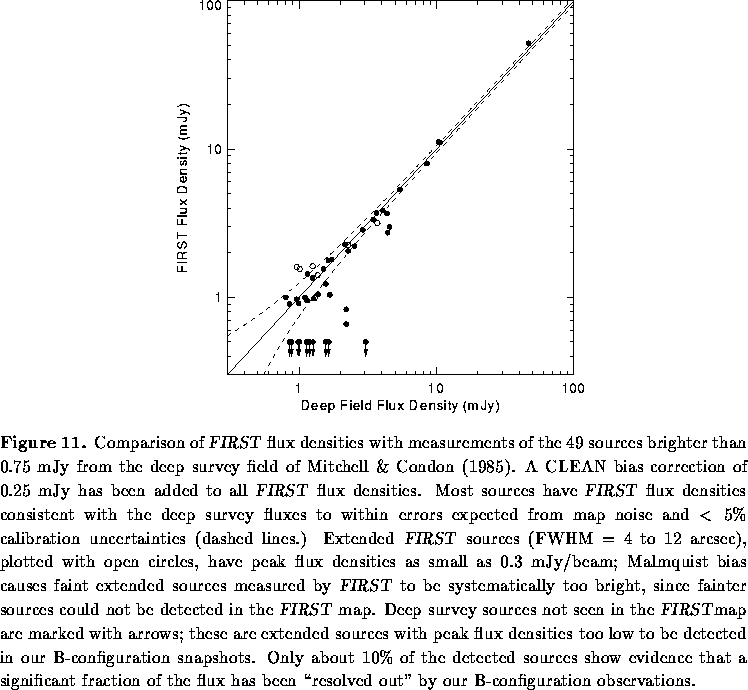
Of the 10 sources not detected in the FIRST survey, 7 are clearly very extended in the deep VLA pointing; in fact, they are the 7 sources with the largest values for the peak-to-integrated flux density ratio in the deep survey catalog. These sources have very low peak surface brightnesses as observed by the B-configuration and so are expected to fall below our threshold. Unfortunately, it is not possible to test our source completeness as a function of size quantitatively from the Mitchell &Condon data, because the Mitchell &Condon maps were not corrected for distortions introduced by the non-planar VLA array (see § 6), so the sizes inferred from the peak-integrated ratio are systematically overestimated (Condon, private communication). Nonetheless, it is clear that the sources missing from the FIRST images are, as expected, only the most extended objects.
On average, we detect
mJy per source less than the integrated flux density reported in
Mitchell and Condon (1985).
Excluding three sources with large discrepancies which could arise
either from source variability in the decade between the observations or from
small
errors in the very large PBCOR values (
) applied to these particular
sources in the deep survey, the mean is reduced to 0.27 mJy, and the
median value is 0.22 mJy. This mean value is the same as that derived from
the insertion of artificial sources into our maps (see § 3.2).
We conclude from this comparison that our CLEAN bias for point sources is
indeed
mJy.
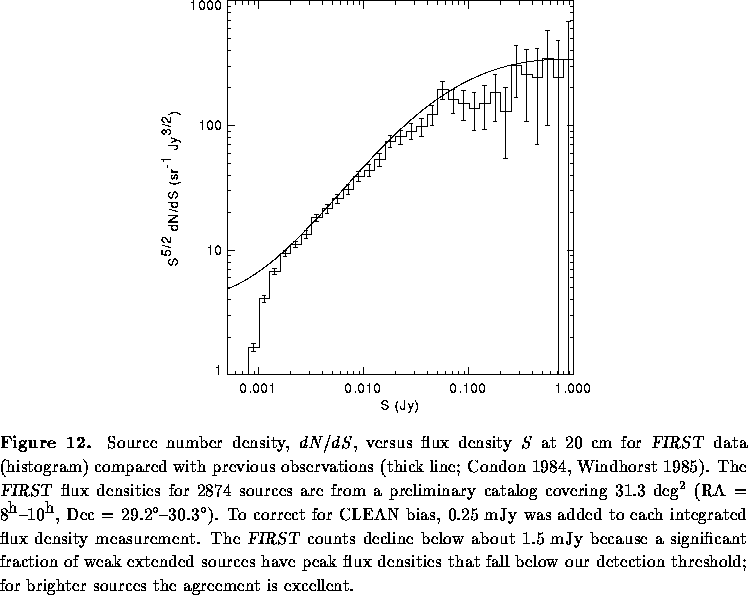
The impact on the overall source counts of both resolution and
our uncertainty about the magnitude of CLEAN bias
effects is not large: a comparison of our distribution for the 1993 data
with that of Windhorst et al. (1985) shows excellent agreement in both slope
and normalization to
mJy (Fig. 12).
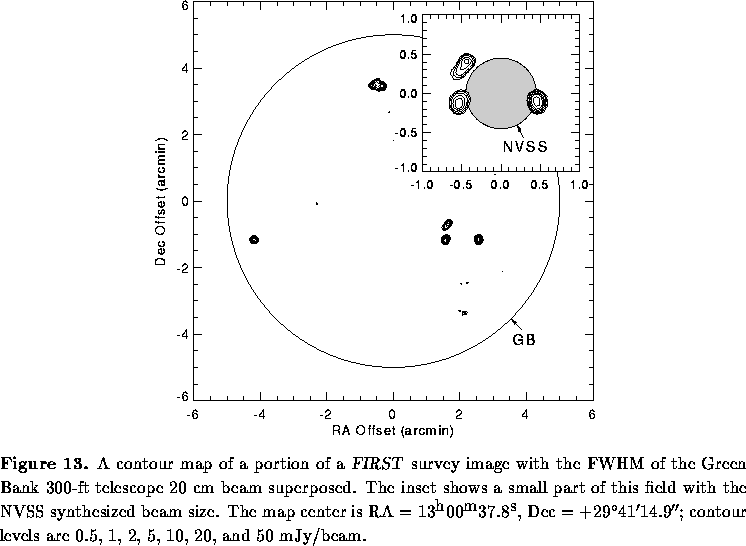
The ability of FIRST to resolve radio source structure down to
a few arcseconds in size is a facet of the survey which may prove to be
of great significance in source classification. Fig. 13
graphically illustrates the improvement over existing work. As a more
quantitative measure of the advantage the beam size
of the B configuration confers, we have determined from our preliminary
catalog of 28,000 entries the number of sources that will be resolved
by FIRST but will appear point-like to the
beam of the NVSS. Adopting a flux density threshold of 2.5 mJy
for the latter survey (Condon et al. 1994), this region of sky will
yield
NVSS sources. These include both discrete isolated
sources above the 2.5 mJy threshold and multiple sources that fall
within one NVSS beam and have a total flux density
mJy. This
source list includes 3000 doubles, 650 triples, 230 objects with more
than three components, and 25000 other sources with angular sizes
(resolvable by FIRST but not by the NVSS.) Thus, FIRST will be able to
provide important morphological information on 55%(6,400 of 12,000)
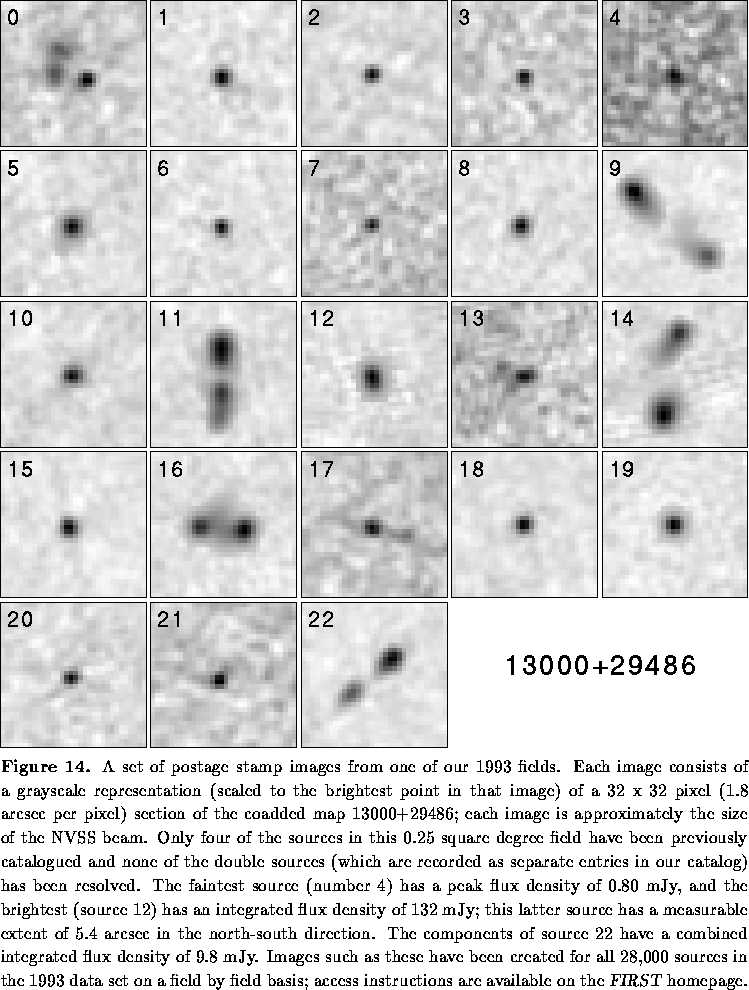
of the NVSS ``point source'' catalog entries. Fig. 14 shows a
few examples from a single FIRST field in the form of the
postage stamps we generate for each source in the catalog.
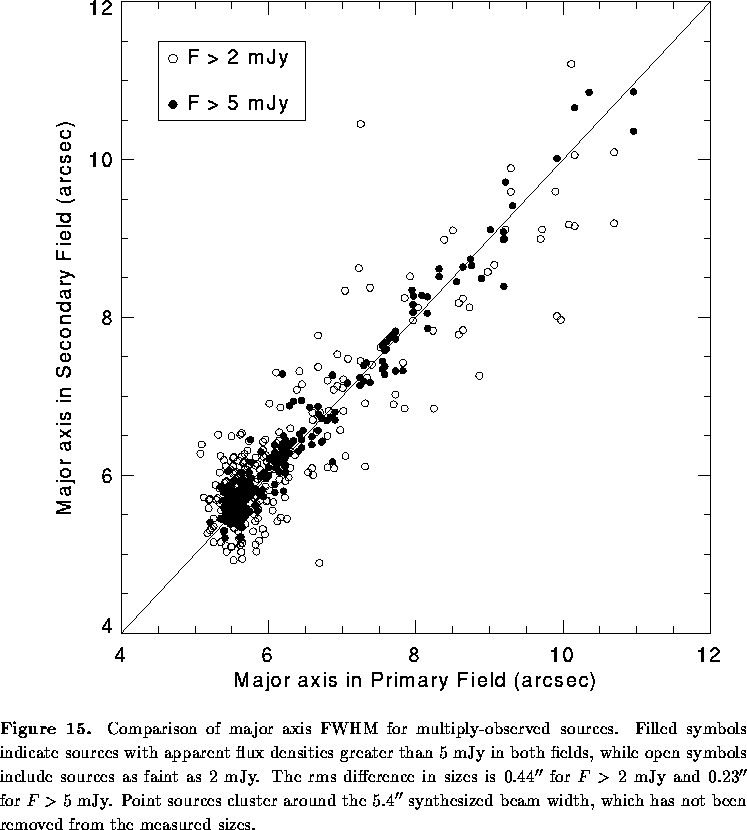
Tests to date indicate that the fitted source size parameters are quite
accurate. We have found that the major and minor axes of sources
derived from adjacent fields is generally in very good agreement (see
Fig. 15). In addition, from our experiments with
artificial sources, we find
that, for sources with flux densities mJy, we recover size estimates
accurate to better than 10%despite the fact that, as described above,
CLEAN bias and overresolution of extended sources compromise photometric
accuracy. Much work remains to be done, however, in exploring
algorithms for quantifying overresolution effects on extended objects,
associating multiple components of complex sources automatically, and
defining likely positions for optical counterparts for extended and
multiple-component objects.
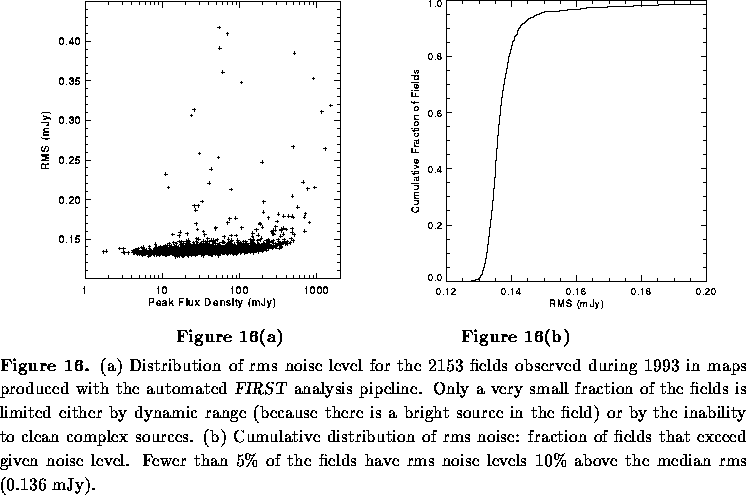
In Fig. 16a, we plot the rms noise level determined from the 2153
individual maps constructed from the 1993 observations; Fig. 16b shows
the integral distribution. Greater than 97%have values
Jy; the coadded images have an even higher fraction of fields for
which a peak flux density threshold of 0.75 mJy represents
. The
increase in both the mean and the scatter for fields containing bright sources
results from incomplete CLEANing of sidelobes in these snapshot images. We
are exploring the value of treating all fields with sources brighter than,
say, 300 mJy, individually, as well as developing
a source detection algorithm which flags
potential sidelobes based on their azimuthal distribution in the map.