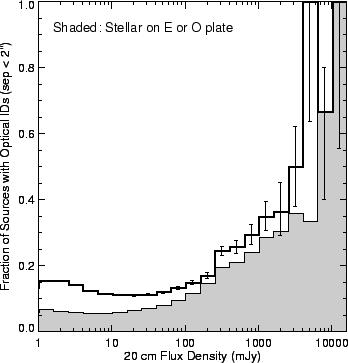
The objects in the FIRST catalog span over four orders of magnitude
in radio flux density, and the identification rate as a function of flux
density is displayed in Figure 18. Even for sources as bright as 1 Jy, only
one-third of the objects have counterparts brighter than the plate limit.
The identification rate falls monotonically with flux density to 20 mJy
where it reaches a minimum of ![]() % and then climbs again toward the
survey limit. The rise at low flux densities reflects the change in the
composition of the radio source population which is dominated by distant
AGN at high flux densities and by nearby star-forming galaxies below
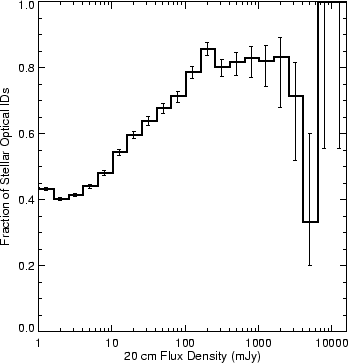
1 mJy (Condon 1992). The fraction of sources classified as stellar on at
least one of the two POSS plates is also reflective of this trend (Figure 19).
Above 100 mJy over 80% of all counterparts are stellar (quasars),
whereas this fraction decreases
monotonically until at 1 mJy, 60% of the counterparts are classified as
galaxies; given the strong tendency toward the misclassification of faint
galaxies as stellar, the true fraction of galaxy counterparts is
considerably higher.
% and then climbs again toward the
survey limit. The rise at low flux densities reflects the change in the
composition of the radio source population which is dominated by distant
AGN at high flux densities and by nearby star-forming galaxies below
1 mJy (Condon 1992). The fraction of sources classified as stellar on at
least one of the two POSS plates is also reflective of this trend (Figure 19).
Above 100 mJy over 80% of all counterparts are stellar (quasars),
whereas this fraction decreases
monotonically until at 1 mJy, 60% of the counterparts are classified as
galaxies; given the strong tendency toward the misclassification of faint
galaxies as stellar, the true fraction of galaxy counterparts is
considerably higher.
 |
 |
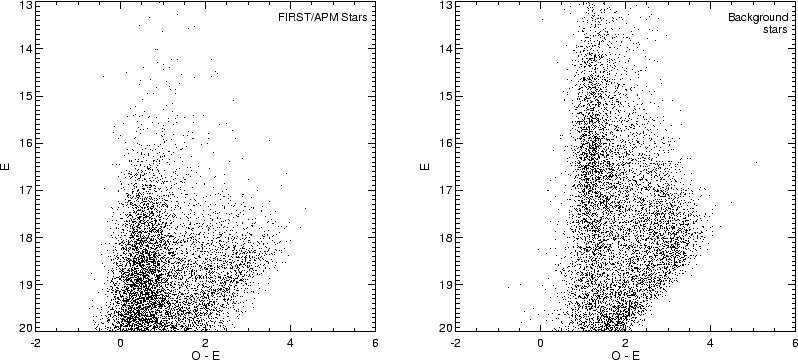
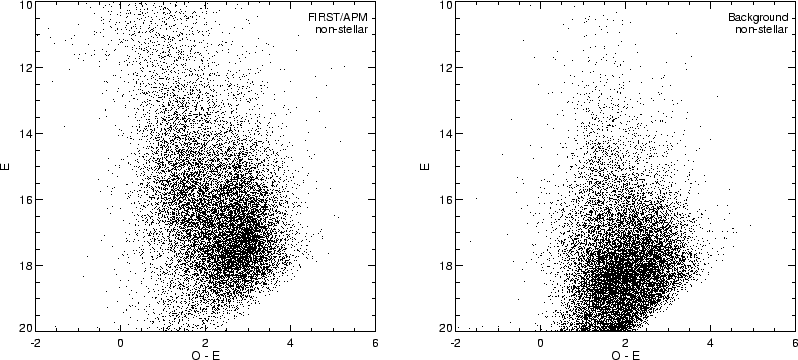
One way to explore the types of objects associated with
FIRST sources is to place the optical counterparts onto a color -
magnitude diagram. In Figures 20 and 21 we show the color-magnitude
diagrams for the `stars' and galaxies (based on a consistent APM
classification from both POSS plates) within ![]() and
and ![]() match radii, respectively.
For comparison, these figures also display similar diagrams for an equal
number of stellar and nonstellar sources taken from random
positions on the same plates.
match radii, respectively.
For comparison, these figures also display similar diagrams for an equal
number of stellar and nonstellar sources taken from random
positions on the same plates.
 |
 |
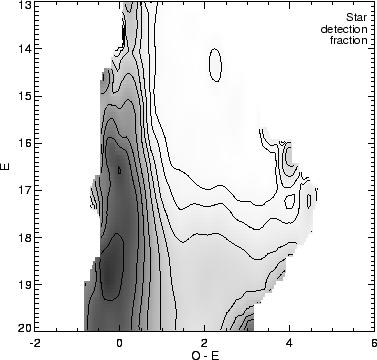
The radio counterparts classified as stellar
are clearly much fainter and much bluer than most `stars'; this is
illustrated in Figure 22, where we plot the fraction of the
radio-detected `stars'
as a function of location in the color-magnitude plane. The detected
fraction peaks at ![]() % for colors around
% for colors around ![]() for
for ![]() . These
objects are nearly all quasars. The increasing fraction of detected objects
with all colors fainter than
. These
objects are nearly all quasars. The increasing fraction of detected objects
with all colors fainter than ![]() magnitude is largely an artifact
produced by the failure of the classifier to distinguish stars from
galaxies near the plate limit; in fact, most of the faint, red stellar
objects are actually galaxies, although a handful of very red objects
have been shown to be high redshift quasars (Hook et al. 1998).
magnitude is largely an artifact
produced by the failure of the classifier to distinguish stars from
galaxies near the plate limit; in fact, most of the faint, red stellar
objects are actually galaxies, although a handful of very red objects
have been shown to be high redshift quasars (Hook et al. 1998).
 |
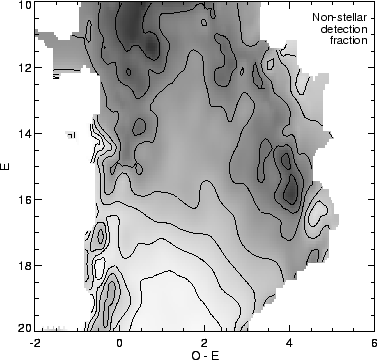
For the nonstellar objects, it is clear that the radio detections are
biased toward brighter magnitudes, but are found for galaxies of
all colors. In Figure 23, we show the detected fraction
of galaxies in the color-magnitude plane. The roughly uniform detection rate as
a function of color and the bias towards brighter galaxies are apparent; up
to 10% of the brightest galaxies are detected and even for E![]() 16,
16, ![]() 2% of
all galaxies have FIRST counterparts.
2% of
all galaxies have FIRST counterparts.
 |