The primary condition for assigning an optical counterpart to a radio source has traditionally been positional coincidence; while other factors can enhance or detract from the probability that the association is correct, these are generally second-order effects. If the positional accuracies for both the radio and optical catalogs are very high, positional coincidence alone can afford a high degree of confidence. In BWH, we calculated the expected error rate for associations between the APM and several hypothetical VLA radio surveys with differing angular resolutions. The reliability of associations based on positional coincidence were presented as a function of optical source density on the sky, and as a function of apparent V magnitude at the North Galactic Pole. The results demonstrated the strong dependence of both reliability and completeness on the angular resolution of the radio survey.
In reality, the actual error rate in radio/optical associations is a complex problem depending on the details of the relative astrometric accuracy of the two data sets, the optical morphology of candidate objects, and radio source morphology. In this section we quantify empirically the reliability of associations between FIRST radio sources and optical counterparts on the POSS-I plates as measured by the APM.
In our analysis of the FIRST-APM match rate, we retain only the closest
optical match to each radio source and vice versa. While the optical catalog
we present below includes all matches out to
![]() ,
not just the closest one,
using only the closest matches when describing the identification statistics
makes understanding the background and true match rates
easier. We want to know the number of radio sources that have optical
counterparts, but we want to avoid double-counting (e.g., a particular
optical object may be the closest counterpart for two different radio
sources.) Also, neither catalog can have pairs of sources with separations of
less than a few arcseconds, which means that there is effectively a
``hole'' in the catalog around each radio or optical source. This
makes it very difficult to calculate chance coincidence rates, since
true matches suppress additional false matches in a complicated
manner.
,
not just the closest one,
using only the closest matches when describing the identification statistics
makes understanding the background and true match rates
easier. We want to know the number of radio sources that have optical
counterparts, but we want to avoid double-counting (e.g., a particular
optical object may be the closest counterpart for two different radio
sources.) Also, neither catalog can have pairs of sources with separations of
less than a few arcseconds, which means that there is effectively a
``hole'' in the catalog around each radio or optical source. This
makes it very difficult to calculate chance coincidence rates, since
true matches suppress additional false matches in a complicated
manner.
We can avoid both of these problems by using only the closest matches. This also modifies the chance background rate, since once a source has a counterpart there can be no additional counterparts at wider separations. This effect is straightforward to understand and incorporate into the background computation: the area being searched for new matches at a given radius is contributed only by FIRST sources that do not already have a closer optical counterpart. Another complication when using closest matches is that the matching circles for close pairs of radio sources can overlap. An optical source that falls in the overlap region between two radio sources can only be assigned as the counterpart to one of them. This is also a mathematically tractable problem. Both effects are treated as a reduction in the effective sky area that is searched as a function of matching separation.
When both of these effects are taken into account, it is possible to
predict the number of chance (false) coincidences as a function of the
radio-optical separation. A simple model for this prediction that
assumes a uniform, random distribution of optical sources on the sky
predicts more coincidences at large separations than are actually
seen, owing to the variation in optical source density
![]() on the sky. In the presence of a varying optical source
density, radio sources that remain unmatched at large separations are
more likely to be found in low-density areas of the sky; consequently,
the effective mean optical source density decreases as the separation
increases. If the variation
on the sky. In the presence of a varying optical source
density, radio sources that remain unmatched at large separations are
more likely to be found in low-density areas of the sky; consequently,
the effective mean optical source density decreases as the separation
increases. If the variation
![]() is not too
large, this can also be modeled fairly simply. For an ensemble of
is not too
large, this can also be modeled fairly simply. For an ensemble of ![]() radio sources, the effective background source density is
radio sources, the effective background source density is
| (6) |
| (7) | |||
| (8) |
| (9) | |||
| (10) |
Our background model, then, has two parameters: the mean
source density
![]() and the variance in the density
and the variance in the density
![]() . Values for these quantities were estimated from a spurious
match catalog generated by offsetting the coordinates of the radio
sources by
. Values for these quantities were estimated from a spurious
match catalog generated by offsetting the coordinates of the radio
sources by ![]() to the south. We use this procedure
instead of simply adopting the match rate between, say, 10" and
20" around the real source positions in order to minimize any
enhancement in the false rate resulting from the presence of real
radio-optical associations at large separations. Such associations
result both from optical counterparts to multiple-component FIRST
objects (where the optical position need not match any one of the
cataloged FIRST components closely) and clustering of galaxies
around FIRST objects (which will produce an uncharacteristically
high optical source surface densities in the vicinity of the radio
sources.) The parameters for the background due to various types of
APM objects are given in Table 1.
to the south. We use this procedure
instead of simply adopting the match rate between, say, 10" and
20" around the real source positions in order to minimize any
enhancement in the false rate resulting from the presence of real
radio-optical associations at large separations. Such associations
result both from optical counterparts to multiple-component FIRST
objects (where the optical position need not match any one of the
cataloged FIRST components closely) and clustering of galaxies
around FIRST objects (which will produce an uncharacteristically
high optical source surface densities in the vicinity of the radio
sources.) The parameters for the background due to various types of
APM objects are given in Table 1.
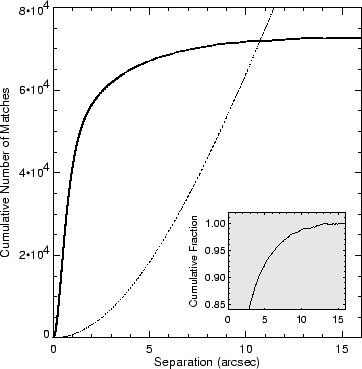
In Figure 8, we display the result of matching all
382,892 radio sources in our catalog to the astrometrically corrected
APM catalog. The plot shows the cumulative excess of matched sources
over the background of chance coincidences as a function of the offset
between the radio and optical positions. We estimate that 98% of the
APM sources within 1" of a FIRST source are physically
associated with the radio source; 42,400 sources meet this criterion.
Even out to 2", 94.5% of the 59,700 associations are real.
Figure 8 indicates that some real matches occur out
to ![]() " although the reliability decreases steadily as the
separation increases. Integrating under the curve of
Figure 8 out to 4" implies 61,800 real
associations (16% of all radio catalog entries). Inside the 1" radius,
16% of the optical counterparts are classified as stellar on both
plates, while 41% are classified as non-stellar on both plates; in the
remaining cases, the classifiers disagree or the object is only
detected on one plate. Note that, at faint magnitudes, classification becomes difficult
owing to the limited number of pixels above threshold; in addition, active
nuclei can make a galaxy appear stellar in the blue band, and the bulges of
faint ellipticals and SOs are generally unresolved. Thus, galaxies are
increasingly classified as stellar as the plate limit is approached.
" although the reliability decreases steadily as the
separation increases. Integrating under the curve of
Figure 8 out to 4" implies 61,800 real
associations (16% of all radio catalog entries). Inside the 1" radius,
16% of the optical counterparts are classified as stellar on both
plates, while 41% are classified as non-stellar on both plates; in the
remaining cases, the classifiers disagree or the object is only
detected on one plate. Note that, at faint magnitudes, classification becomes difficult
owing to the limited number of pixels above threshold; in addition, active
nuclei can make a galaxy appear stellar in the blue band, and the bulges of
faint ellipticals and SOs are generally unresolved. Thus, galaxies are
increasingly classified as stellar as the plate limit is approached.
 |
In Table 3 we tabulate the completeness and reliability of objects that are only detected on a single red or blue plate. These have been estimated by shifting the radio positions by 3 arcmin in declination and running the matching analysis in an identical manner on this shifted dataset. This shows that 92.7% of the blue-only matches within 1" are real, and 97.5% of the red-only matches within 1" are real matches. This is a lower limit on whether these single band detections are real objects since we expect some of the the chance associations to be real celestial objects.
The matching results are more complicated to analyze when we take into account
the complex radio sources that get broken into two or more components in
the FIRST catalog. We call these ``gregarious'' sources (as
distinguished from isolated sources) because they are found in clumps
on the sky. Note that some gregarious sources are simply the chance
superposition of two unrelated radio emitters at different distances;
nonetheless, from our vantage point, they are gregarious, and confuse
the matching statistics in a manner similar to that of the real multi-component
objects. We define the sociological boundary between gregarious and isolated
at
![]() ; i.e., any source with no other catalog entry within a radius of
; i.e., any source with no other catalog entry within a radius of
![]() is classified as isolated, and all
other sources are labeled gregarious. Such a fixed boundary is arbitrary, and,
indeed, a small number of very extended objects will be incorrectly classified
as isolated; we discuss this matter further in § 5.
is classified as isolated, and all
other sources are labeled gregarious. Such a fixed boundary is arbitrary, and,
indeed, a small number of very extended objects will be incorrectly classified
as isolated; we discuss this matter further in § 5.
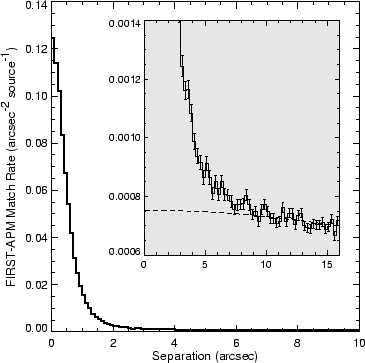
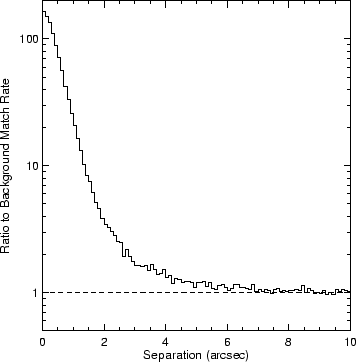
In Figure 9, we display the number of isolated matched sources as a function of the offset between the radio and optical positions in 0.1" bins, normalized by the annular area of each bin. Figure 10 displays the ratio of the number of matches to the predicted false rate as a function of separation.
 |
 |
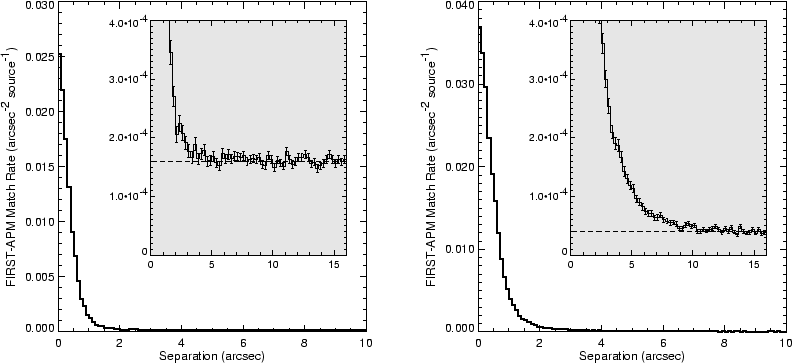
Both the background rate and the typical angular separation between FIRST and APM positions depend strongly on the optical classification. Figure 11 shows the distribution of separations for sources classified as stellar on both plates or non-stellar on both plates. The FIRST-APM positions typically differ by more for galaxies, which have less well-determined optical positions. However, it is easier to identify galaxies confidently as FIRST counterparts because the background rate for galaxies is four times smaller than for stars (see Table 1).
 |
We quantify this effect by calculating the angular radius which
contains 90% of the real associations as well as the percentage of
false matches within the same radius. For example, these numbers are
4.2" and 17% for the distribution of all FIRST/APM sources as
shown in Figure 8. If we restrict the match to APM
objects that are classified as galaxies on both plates
(Fig. 11b), the values are
![]() and
2.7%. The 90% radius is quite similar to that for all associations,
since galaxies constitute the majority of all identifications; however,
the reliability for galaxies is much higher because the background rate
for galaxies is smaller
(Fig. 11). By comparison, if we restrict
ourselves to APM sources that are stellar on both POSS plates
(Fig. 11a), the 90% radius and error rate are
and
2.7%. The 90% radius is quite similar to that for all associations,
since galaxies constitute the majority of all identifications; however,
the reliability for galaxies is much higher because the background rate
for galaxies is smaller
(Fig. 11). By comparison, if we restrict
ourselves to APM sources that are stellar on both POSS plates
(Fig. 11a), the 90% radius and error rate are
![]() and 6%. The smaller footprint of stars on the POSS-I leads
to more accurate optical positions (hence the smaller 90% radius).
These and other cases are summarized in Table 2
and in Figure 12, which displays the
completeness and reliability of matches as a function of separation.
and 6%. The smaller footprint of stars on the POSS-I leads
to more accurate optical positions (hence the smaller 90% radius).
These and other cases are summarized in Table 2
and in Figure 12, which displays the
completeness and reliability of matches as a function of separation.
 |
The statistical agreement between FIRST and APM positions is also affected by the morphology of FIRST sources. If we restrict the FIRST sample to point-like radio sources (but include all APM sources), the 90% association radius is 2.0" with a false rate of 5%. Limiting the discussion to sources that are point-like in both the radio and the optical results in 90% of the matches within 1.1" with a 2.4% false rate.
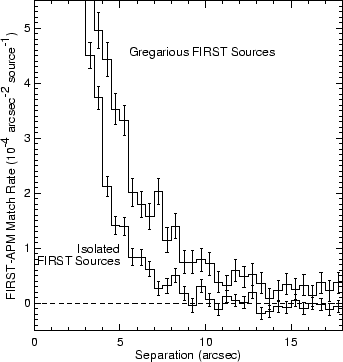 |
Figure 13 compares the histogram of
separations for isolated sources with that for the gregarious sources.
It can be
seen that gregarious sources contribute most of the matches at large
separations; indeed, they show evidence for a statistically significant
excess of matches even beyond
![]() . Many of the gregarious FIRST
sources are components of classical double radio sources, which may
have no radio component at the center of the double. Consequently the
optical counterpart will typically be
. Many of the gregarious FIRST
sources are components of classical double radio sources, which may
have no radio component at the center of the double. Consequently the
optical counterpart will typically be ![]() the double separation
from each component. We now begin to explore counterpart identification
strategies for such sources.
the double separation
from each component. We now begin to explore counterpart identification
strategies for such sources.
The wide variety of radio source morphologies (not to mention the extent to which their appearance depends on the resolution of the survey) makes it difficult to design a robust algorithm that predicts the locations of the optical counterparts to multiple-component sources. We present here an empirical approach to the problem for the simplest class of such sources - isolated doubles.
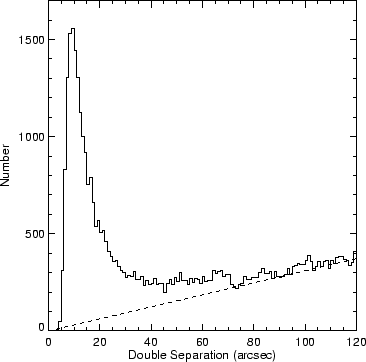 |
Figure 14 displays the distribution of ![]() isolated pairs of
FIRST sources as a function of their separation. The minimum value of
isolated pairs of
FIRST sources as a function of their separation. The minimum value of
![]() is imposed by the source detection algorithm (WBGH).
The fall-off in the number of detected doubles beyond
is imposed by the source detection algorithm (WBGH).
The fall-off in the number of detected doubles beyond
![]() reflects a number of factors: 1) the
reflects a number of factors: 1) the
![]() survey beam resolves out very extended features and will therefore not
detect sources on the largest scales, 2) the exclusion of triples and other
multiple component sources from this subsample will preferentially remove
extended sources on larger scales, and 3) there is a
real decline in the number of large angular-diameter objects. For comparison
with the APM catalog, we have selected objects with separations in the range
survey beam resolves out very extended features and will therefore not
detect sources on the largest scales, 2) the exclusion of triples and other
multiple component sources from this subsample will preferentially remove
extended sources on larger scales, and 3) there is a
real decline in the number of large angular-diameter objects. For comparison
with the APM catalog, we have selected objects with separations in the range
![]() .
.
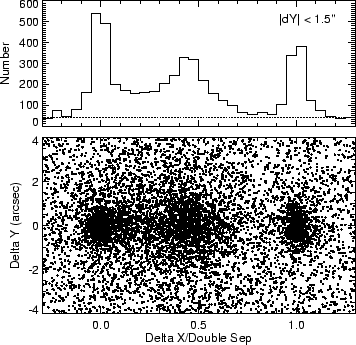
The lower portion of Figure 15 displays the distribution of optical objects
in the vicinity of the 21,579 pairs of radio sources meeting this criterion.
The x-axis for each pair is defined
by the line joining the centroids of the two objects; the scale is normalized to the
separation, with the origin chosen as the brighter of the two components. The
upper panel shows a histogram for all optical objects within
![]() of
the line joining to two components; the expected false rate from a uniform distribution of sources with the
same mean surface density as the FIRST survey is shown as the
dashed line. Several features of the distribution are
immediately apparent. There is a large concentration of optical objects coincident
with the brighter of the two radio components, suggesting a core-jet
morphology. A roughly equal number of identifications is found approximately
half way between the two components with a slight bias in the direction of
the brighter
lobe; the broader spread in the y-direction for these counterparts reflects in
part the bending of radio lobes as a consequence of their interaction with
the intergalactic medium (e.g., Blanton et al. 2000, 2001). Finally, a much smaller
fraction of the identifications is coincident with the weaker of the two lobes.
The overall identification rate derived from integrating the upper curve and
subtracting the background rate is
of
the line joining to two components; the expected false rate from a uniform distribution of sources with the
same mean surface density as the FIRST survey is shown as the
dashed line. Several features of the distribution are
immediately apparent. There is a large concentration of optical objects coincident
with the brighter of the two radio components, suggesting a core-jet
morphology. A roughly equal number of identifications is found approximately
half way between the two components with a slight bias in the direction of
the brighter
lobe; the broader spread in the y-direction for these counterparts reflects in
part the bending of radio lobes as a consequence of their interaction with
the intergalactic medium (e.g., Blanton et al. 2000, 2001). Finally, a much smaller
fraction of the identifications is coincident with the weaker of the two lobes.
The overall identification rate derived from integrating the upper curve and
subtracting the background rate is ![]() %, similar to
that for the radio sample as a whole.
%, similar to
that for the radio sample as a whole.
 |
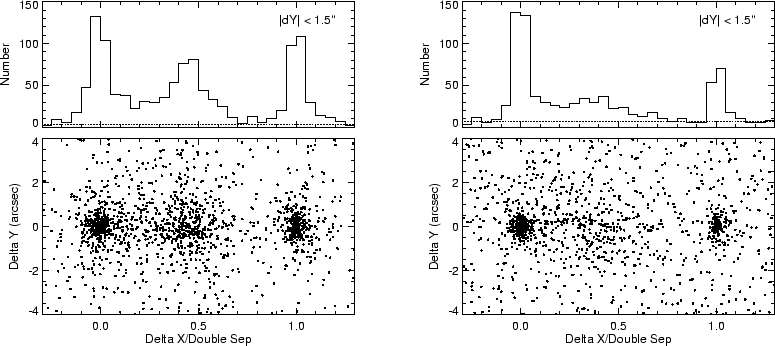 |
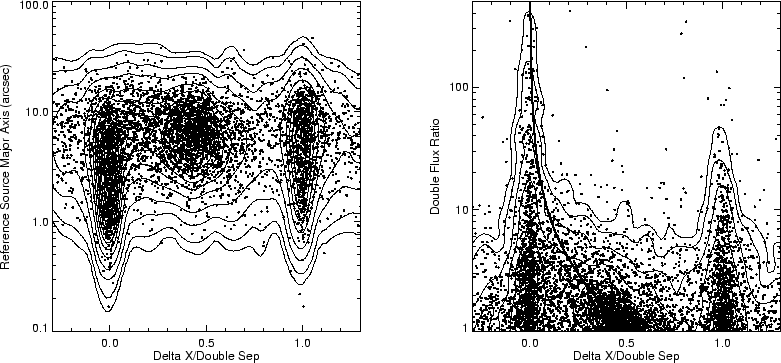
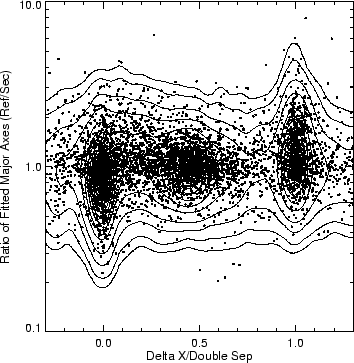
Dividing the optical counterparts by morphological class yields additional interesting results. The objects classified as galaxies on both plates (Figure 16a) produce the most counterparts midway between the components, while the stellar objects are predominantly associated with the brighter radio component (Figure 16b). Figure 17 shows that many of these core components are small in size (panel a) and are much brighter (panel b) than the other component: the median flux ratio for sources where the optical counterpart matches the brighter radio component is 3.0, while the median for the central-component matches is 1.4. When the brighter of the radio components identifies the optical counterpart, it also tends to be the smaller of the two components (panel c). Likewise, for cases in which the dimmer source has the optical counterpart, it tends to be smaller. In contrast, the sources with identifications that lie between the two radio lobes have very narrow ranges of flux density and size ratios near unity, and are virtually all resolved.
 |
 |
Using these trends in radio source component flux density
and size ratios, total extents,
and optical morphology (in addition to magnitude and color, perhaps) it would
be possible to develop a reasonably reliable identification algorithm for double
and multiple FIRST sources, although we regard such an effort as beyond the
scope of this paper.
What is clear from the foregoing analysis is that, since
the identification rate for complex sources is similar to that for
single-component objects, the effect on the final fraction of radio emitters
identifiable at the POSS-I plate limit simply scales with the number of radio
components removed from consideration as a consequence of their association
with another catalog entry. Using an algorithm that assigns a probability to
component associations based on flux density and separation, we find that,
for separations up to
![]() there are 32,312 doubles
there are 32,312 doubles![]() , 12,802 triples, and 5,716
groups of four or more sources with a probability of real association
, 12,802 triples, and 5,716
groups of four or more sources with a probability of real association ![]() .
This reduces our catalog to
.
This reduces our catalog to ![]() discrete radio emitters and yields
an overall identified fraction at the POSS-I limit of
discrete radio emitters and yields
an overall identified fraction at the POSS-I limit of ![]() %.
%.