The data analysis procedures required to generate high-resolution,
widefield images from B-configuration VLA data are computer intensive,
and at first glance, are beyond the capability of computers available to
astronomers. Imaging the full primary beam requires a
image, but ignores the likelihood of bright sources in sidelobes beyond
the first zero of the beam pattern.
Proper self-calibration of the data normally requires mapping all the
sources contributing to the observed visibility function. To avoid
repeatedly creating such large images we have taken advantage of
existing radio catalogs, in particular the Greenbank 1400 MHz survey
(White &Becker 1992). The first step in self-calibration
is to generate a tapered map
of the primary beam and satellite maps of all the outlying sources
found in the Greenbank catalog
out to that will appear brighter than 2 mJy.
The resulting maps are
searched for sources and a source list is written to a disk file.
These sources are then used as input to a self-calibration script
which makes small maps around each and every discrete source, thus
avoiding the need to make large images. With this methodology we can
self-calibrate
fields a day using a Sparc 10/41 processor.
In general, we do a 3 iteration phase self-calibration on any field
containing at least one source brighter than 30 mJy.
All the observations from Spring 1993 have already been self-calibrated.
Once the data are self-calibrated, the field is imaged into a 2k by 2k
map using the AIPS task WFCLN. We typically clean the images to a flux
density level of 0.5 mJy (). A Sparc 10/41 processor with
megabytes of memory can create
images/day. The
images so produced are distorted because of the 3-D nature of the
Celestial Sphere in contrast to the 2-D FFT done by WFCLN. But, since
the observations were made as short duration snapshots, the distortion
is correctable using the AIPS task OHGEO which transforms the image
onto the correct
coordinate grid. The overlapping areas of adjacent images
will be summed to increase the sensitivity of the survey.
All the images from Spring 1993 will be created by January 1994.
As of October 1, we have generated 600 images. In Figure 1
we show the
distribution of peak flux densities and rms noise levels for these
images.
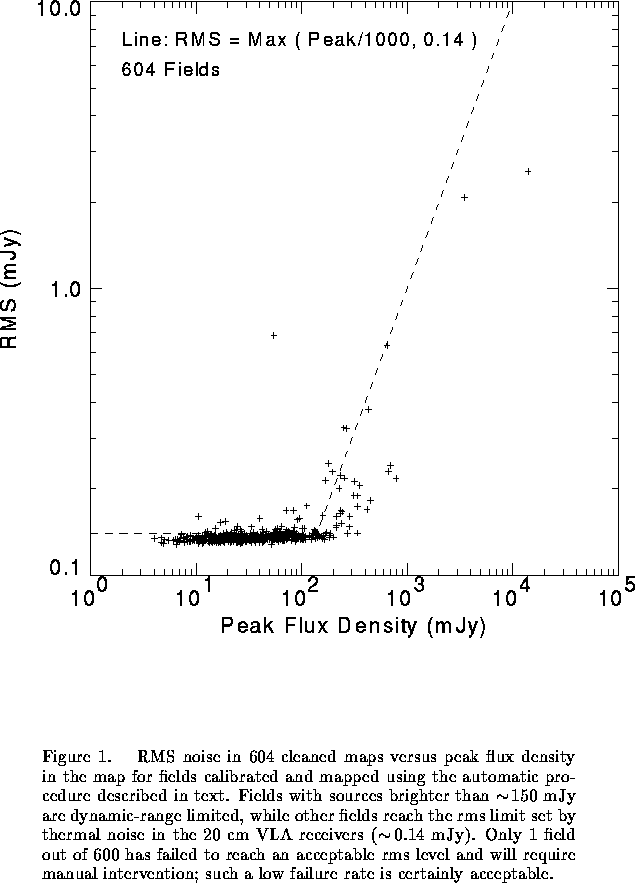
The vast majority of the images (%) achieve the
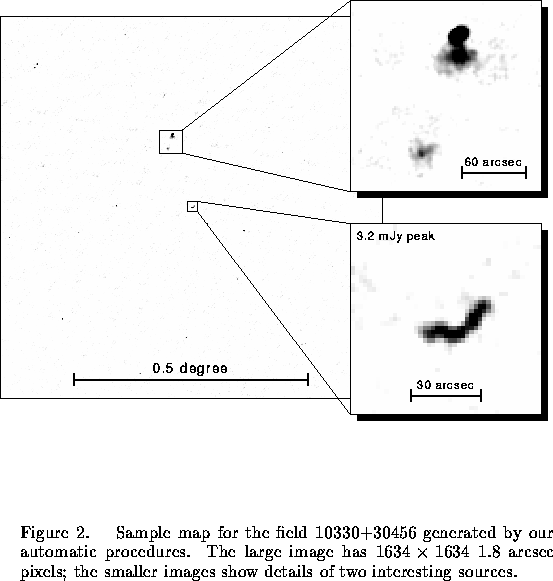
theoretical noise limit. In Figure 2
we display one of these images to
illustrate what the community can expect from the survey.
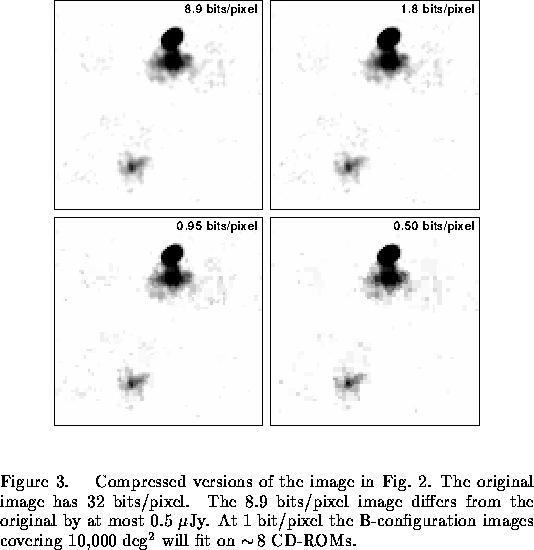
Although the necessary software does not yet exist, we intend to search the final images to extract discrete sources and construct a survey catalog. The catalog will contain source positions accurate to better than an arcsec, flux densities, and morphological information. We also plan to distribute the images in compressed format (White, Postman, &Lattanzi 1992; White 1993) so that the entire survey will reside on several CD-ROMs. A sample compressed image is shown in Figure 3.